

A "Step-by-Step" Guide to the C.A.R.

|
There are two parts to a C.A.R. project: a written report and a presentation.
The final report that you write serves the purpose of sharing the knowledge gained through action research with others. Action researchers will need to decide what to write and to whom to present. Stuff just got real, didn't it? But don't panic. You can have a social life next year! There are 15 steps that you'll need to follow in order to stay focused - and on track - in order to pull this thing off. 
You could hope for this, I suppose... but it may be nicer to all of humanity if you just did the C.A.R. [Click picture for a larger version.]
|

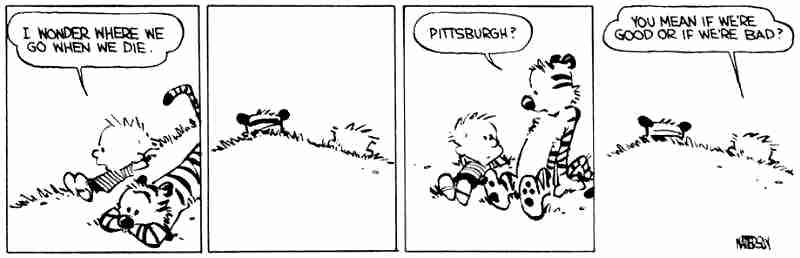
Yes it did, Bobby. Yes. It. Did. [Click picture for a larger version.]

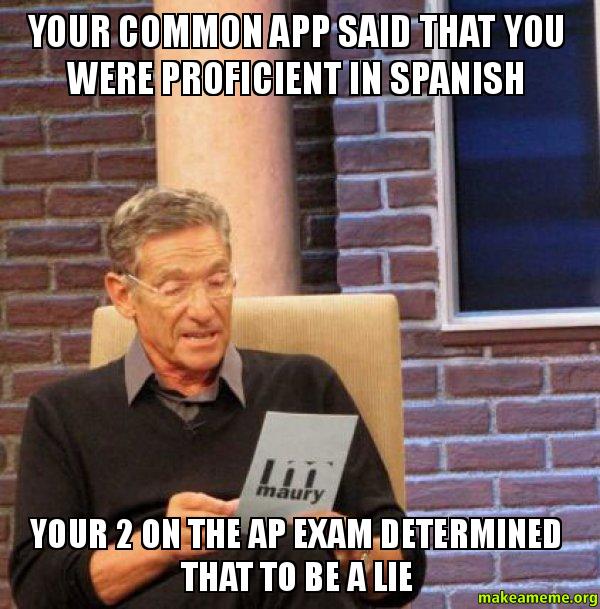
You can thank your guidance counselor for the predicament in which you now find yourself. [Click picture for a larger version]
|
Calvin puts the "action" in Action Research... [Click picture for a larger version.]

STEP #1: Mentally prepare for the task at hand

No. [Click picture for a larger version.]
The patented Batman Bat-hand... [Click picture for a larger version.]

Don't worry... 5-Hour Energy comes in many delicious "flavors"! [Click picture for a larger version.]
|
This isn't meant to scare you, but, completing a C.A.R. project is not like whipping together a book report. (SparkNotes and Wikipedia certainly won't save you now!) A C.A.R. project is a process by which you review timely literature, conduct the actual research yourself, analyze the results, and present your findings. In short, you are doing actual research and contributing a body of knowledge that can be accessed by future researchers. This will be an impressive endeavor.
Because Dr. Hartnell is expecting brilliance, you will be given the entire school year to complete this C.A.R. project. Yes, you read that correctly. You will have (in the ballpark of) EIGHT months for this assignment. With such a huge chunk of time, the feeling is often to put this off... for a few days... which become a few weeks... which become a few months. You will need to start NOW. The early bird catches the worm... and the early researcher gets "first dibs" on the best topics. If too many people select the same "problem" to research, aside from a death match in the hallway to establish supremacy, Dr. Hartnell will operate on a first-come-first-serve basis. This doesn't mean you can call "shotgun" on any topic you want by blurting it out - you will need to show that you have begun and have made significant progress. However, a student that has started her/his Literature Review will be in the driver's seat compared to a student still mulling around for ideas. Strap in. It's GO time! For a timeline to help pace yourself, click here. |
I've read papers like this before... [Click picture for a larger version.]
STEP #2: Identify a "problem"/pick a research topic
|
Congratulations! You've been called up to the big leagues! You're NOT reviewing Old Yeller... you're NOT researching the Civil War... you're identifying a real problem that you see in your local surroundings... and you're going to conduct authentic and real research. Time to Martin Luther this bad boy! (As in the guy that started the Reformation. Anyone?) So put on your big boy or big girl pants (or both, you know, if you need the extra "comfort"... just please put on some pants)... and let's dive in! For starters, you get to call yourself an "action researcher" when you write your paper... as in "The action researcher surveyed 100 students at..." No kidding! That's the official title you can pin on your vest (if you wear a vest). And, seriously, you're about to change the research game. You're going to do something that has the potential to shake things up... you know, Reformation-style! (Did anyone appreciate this reference? Yes?!)
For more information on picking a "problem" and writing a research question, click here. 
Oh, so it's cute when HE does it? Whatever... [Click picture for a larger version.]
|

[Click the picture... and see what happens...]

He's been here for you since 1990... [Click picture for a larger version.]
|
Then stop calling him, Peppermint Patty... [Click picture for a larger version.]
STEP #3: Conduct and write a Literature Review
Don't let this happen to you... [Click picture for a larger version.]
Nailed it. [Click picture for a larger version.]
|
Many of us are in the habit of turning on the computer, opening up a Word document, and hammering out a 3-5 page paper like it's nothing. Others find themselves staring at a blinking cursor on a blank screen. After many wasted hours of being mocked by the emptiness of the page, they default to creating a Cover Page before calling it quits for the day/week/weekend...
Both of these approaches will not work for your C.A.R. final report. There are 10 major "parts" to the written C.A.R. final report. However, it is not going to be written (or researched) in the order in which it appears below. Translation... you will be working with four, five, or six different Word documents that all contain bits and pieces of the different sections of your paper that have been written out... of... sequence. Organized chaos, so to speak. But, if you follow this Step-by-Step Guide, it'll all make sense. Listed below are the 10 major "parts" that MUST be included in your C.A.R. final report. Additional information for each section, along with a sample, can be found by clicking the buttons. |
1. Cover Page
|
2. Abstract
|
3. Introduction
|
4. Literature Review
|
5. Research Process
|
6. Data Analysis
|
7. Reflection
|
8. Action Plan
|
9. Annotated Bib.
|
10. Appendix
|

Yo dawg! Thanks. [Click picture for a larger version.]

[Click picture... to visit this all-knowing owl that attends Purdue...]

I'm right there with you... [Click picture for a larger version]

Thank you for being the responsible one, Homer... [Click picture for a larger version.]

I've seen that face before... [Click picture for a larger version.]

Especially because that's five more sources than the minimum requirement... [Click picture for a larger version.]
|
Up first... the Literature Review
(or "Lit Review" as it's known on the streets - although, to be honest, I think it's been called much worse). Think of the "Lit Review" as a book report about your problem or research topic. Your job as an action researcher is to find everything that has already been written about your topic... read it... summarize it... and combine it into one uber-report on the literature.
When you find a source you wish to review and use, be sure to write down the proper MLA information so you can cite it later. If nothing else, if it is an on-line source, save yourself the headache and at least copy the URL so you can find the site again. (Click here for a refresher on the MLA Style and how to cite.) Next, put each source on a separate sheet of paper (or in a separate Word document). This way it is easier to flip back and forth when you need to access this information. On these pages, summarize the article and pick out one or two direct quotes that could come in handy. Essentially, by summarizing each source as you go, you are also writing your Annotated Bibliography (but more on that later). If you're researching whether or not homework should be counted for points, make sure you track down an equal number of pro- and anti- pieces to review (or at least as close to equal as you can find). Neutral and factual articles are also essential. For this project, the absolute bare minimum is TEN sources - although most people wind up using 15 or more. (Trust me, that's not as hard to do as it may seem...) Your sources can be newspaper articles, magazines, on-line articles, and other research studies. Ideally, if you're doing research into start and end times of high schools across the U.S., try to track down other studies that have been done before. This will aid you tremendously in how you will want to approach your own version of this project. If you come across a great article and the author's contact information is listed (e-mail, Twitter, etc.), contact them! Let them know what you're doing and see if they can help you. Writing the actual Literature Review is fairly easy once you have summarized all of your articles. The key is finding similarities among your sources. This means if three of your articles talk about "XYZ", when you discuss "XYZ" in your Literature Review, you will need to reference these three articles. Your Literature Review is NOT to be written so every paragraph is just a summary of a different source that methodically rolls from one source to the next. Rather, you want your paper to "flow" and cover an array of topics as your Literature Review unwinds. This "blending" of sources creates a spectacular (and legitimate) review of the literature. For many, the Lit Review is the hardest part of the C.A.R., and since it helps drive the project, it will be the most time consuming. For helpful hints and to see a sample Literature Review, click here. 
Noted. [Click picture for a larger version.]
|
Nothing wrong with polishing a terd... [Click picture for a larger version.]
STEP #4: Create a survey/interview; prepare Appendix
|
This is an "ACTION" research project. Not a "passive" research project. Not a "sit-back-and-see-what-others-have-done" project. The word "action" should tip you off to the fact that you will be doing authentic research. The easiest approach to this is to distribute a survey and/or conduct interviews.
IMPORTANT: The earlier you conduct your survey/interview, the better your results. If you conduct a survey of eight WNHS Advisories in October, you stand a better chance of teachers cooperating. If you choose to do this in May - when the year is winding down and the last thing teachers need is "one more thing to do" - then you run the risk of having NO data for your C.A.R. project. No data = No grade. (Actually, you still get a grade... but it's probably not the one you want.) A crucial mistake often made is waiting until you are done with your Lit Review before administering a survey. Once you feel confident that you are going to stick with your topic - even if you're only halfway through your Lit Review - crank that survey out! Remember! You will need to submit a copy of all surveys produced (with tallied results) and a transcript of questions asked (and answers received) for any interviews. As such, make sure you save an electronic copy that you can include in the section at the end of your paper that's called the "Appendix". The Appendix contains all of the supplementary materials that are too cumbersome to include directly in the text of your C.A.R. paper. However, this material is vital in providing a comprehensive understanding of the research question, which is why it is housed in this section. The Appendix allows you to make references to your survey or interview throughout your paper without having to type out every question word-for-word. This, in turn, keeps a nice "flow" to your paper. For more information on writing a survey or conducting an interview, click here. For helpful hints and to see a sample Appendix, click here. 
It's funny... 'cuz it's true... [Click picture for a larger version.]
|

In that case, I'll just do the survey... [Click picture for a larger version.]

But it's the weekend! [Click picture for a larger version.]
Try to work the word "fiddlesticks" into your daily conversations... [Click picture for a larger version.]
Or just answer "C"... [Click picture for a larger version.]
Clever. [Click picture for a larger version.]
|
Me, too!!! [Click picture for a larger version.]
STEP #5: Crunch the numbers and analyze the data
|
This portion of your research can be the most rewarding. (OK, being done with the entire thing is the most rewarding... but, hey, this part gives you a chance for "fun with numbers"!) With your surveys collected, start tallying the results. Keep scrupulous notes on EVERYTHING. Itemize your survey results by age, gender, grade-level, race (if that was a survey option), and so forth. Be sure to save EVERYTHING. What usually happens is after you've tabulated 60 or so surveys, the next day you come into class and there is a stack of 25 additional surveys waiting for you in the "out" box in the back of the room. Don't fret! If you've kept a tally sheet, adding in additional survey results is easy. But, keep in mind that you do hold executive power over a "cut off" date for infusing new numbers into your results. If you've looked over 100 surveys... and six more roll in a week after your survey is "closed"... you can elect to scrap those six. (Executive power is delicious!)
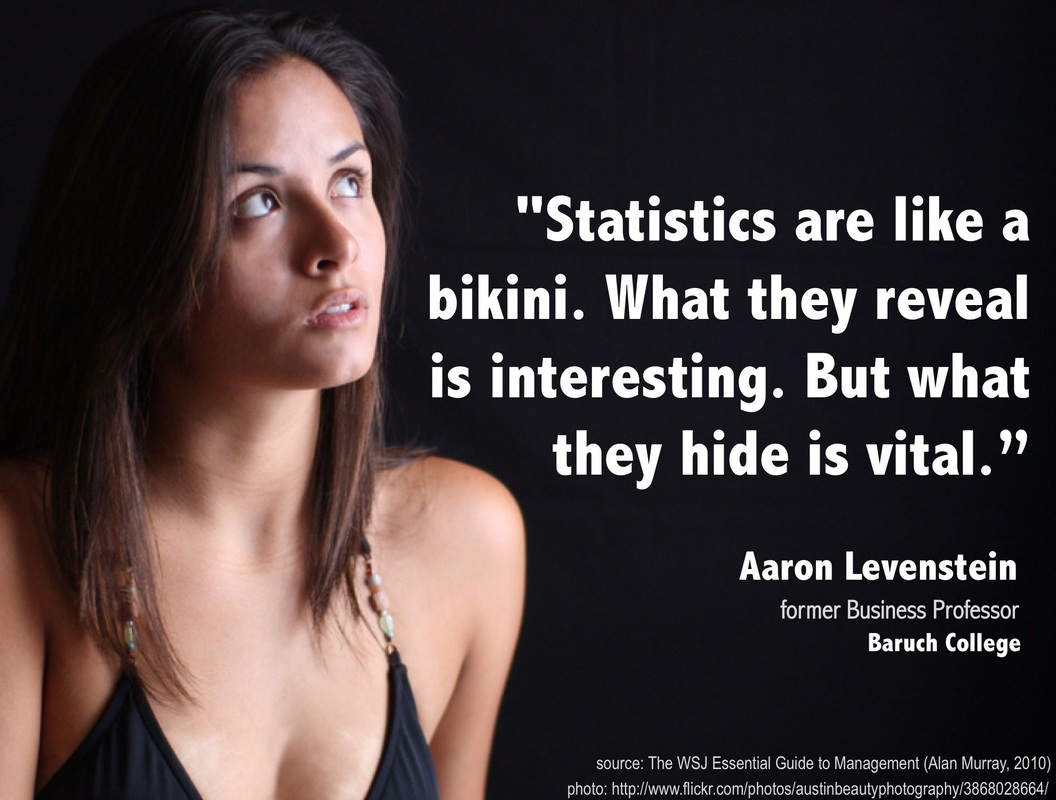
Keep in mind that "fun with numbers" (apart from being "relative") anoints you with a LOT of power. Many moons ago, the Superintendent of WCS spoke at a teacher meeting about scores on the latest round of AP Tests. Throughout his presentation, he continually (and nauseatingly) applauded the World Languages Department for having 100% of students that took the Spanish AP Test score a "5". (A "5" is the highest you can get on an AP Test, which is scored on a "1-5" scale) In the process of slobbering over the Spanish "scores", he spoke down to the History Department for having only 75% of its students that took the History or Government AP Tests score a "5". There was one problem... and it took a bald, bearded first-year teacher to pick up on this. If you looked up the actual numbers of test takers (which was tucked away in the "raw data" portion of the Superintendent's Data Appendix), you saw that ONLY ONE student took the Spanish AP Test!!! Wait. What?! That's right. One student took the test. And that student scored a "5". So, of course 100% of those that took the Spanish AP test scored a "5"! By comparison, 100 students took the History or Government AP Tests, and 75 of them scored a "5". However, percentage wise, that was "only" 75%. When the raw numbers in the Appendix were compared, 75 history students scoring a "5" clearly trumps one Spanish student scoring a "5"... but if you report just the percentages, the World Languages Department could legitimately argue that 100% of their students scored a "5" to the History Department's woeful 75%. The Superintendent didn't "fudge" the numbers. He didn't pad the Spanish stats, either. He simply opted to use percentages instead of raw numbers. He put his executive power to use. You possess similar jurisdiction over your numbers when it comes to reporting your "data". Let's say you distributed a survey to 50 anonymous sophomore students about teen drinking. When the surveys were returned, you recorded that 10 of the respondants were girls and 40 were boys. Nine of the 10 girls admitted to having had at least one alcoholic drink in the past three months. In regards to the same question about drinking, 24 of the 40 boys said they had consumed alcohol. Simple numbers, right? Sure. But now it gets interesting. When it comes time to present this data, there are several different ways of using the same results to fit the slant/angle, tone/intent, and/or motivation of your project: Option #1: Of the 50 sophomore students surveyed, 33 admitted to having had at least one alcoholic drink in the past three months. This is a "raw" approach. BAM. You give the reader the numbers... but you don't do the math for them. Option #2: Of the 50 sophomore students surveyed, 66% admitted to having had at least one alcoholic drink in the past three months. This is another "raw" approach. You give the reader the percentage... but you let them figure out the exact number of naughty drinking teenage sinners. Option #3: Of the 50 sophomore students surveyed, 33 (or 66%) admitted to having had at least one alcoholic drink in the past three months. This is very complete (and scholarly) approach. You lay it all out on the table for the reader. No tricks. No "clever-wording". You provide the number of survey participants, how many said they've boozed it up, and give the percentage. You save the reader from having to do any math or tracking down raw numbers in the Appendix. Your generosity earns you a Scooby Snack. Option #4: When asked whether they've consumed at least one alcoholic drink in the last three months, 66% of sophomores admitted that they had done so. Oh my! I see what you did there! You took the ol' "fire-and-brimstone" approach. While you aren't lying - and you're not fudging the numbers - you are presenting the data in a fashion that is open to interpretation. By leaving out how many students were surveyed, you paint a grim picture that 66% of all sophomores drink. (Hey, at least you're not bitter that you weren't invited to Mike's big party, right?) While this is factually correct, it is a sleazy way of presenting actual data. If you simply add the word "surveyed" after the word "sophomores" so that it reads "66% of the sophomores surveyed...", you reduce speculation (or misinterpretation) that 66% of the entire sophomore class drinks and keep it to just those surveyed. If the reader wants specific numbers on how many were surveyed, they can reference your Appendix. Option #5: Of the 10 sophomore females and 40 sophomore males surveyed, 9 girls and 24 boys admitted to having had at least one alcoholic drink in the past three months. In this option, you break the results down by gender. You give the reader the numbers but withhold percentages. The low number of female survey respondents, however, may raise some eyebrows about the reliabilty of your numbers. Are the responses of only nine females a true reflection of the drinking habits of all sophomore girls? In this sitiation, you would be advised to track down more females to try to bring up their numbers. Option #6: Of the 10 sophomore females and 40 sophomore males surveyed, 90% of the girls and 60% of the boys admitted to having had at least one alcoholic drink in the past three months. Similar to the issues brought up in Option #5, this option provides percentages. While the exact number of boys could be tougher to come up with on the spot, any basic math student can deduce that 90% of 10 is nine. The wordiness of this option, coupled with the realization by the reader that only 10 females were surveyed, gives a feeling that you are trying to mask your low female numbers. A better way of writing this is shown below in Option #7. Option #7: Of the 10 sophomore females and 40 sophomore males surveyed, nine girls (90%) and 24 boys (60%) admitted to having had at least one alcoholic drink in the past three months. While this approach doesn't solve your lack of female participation in the survey, it at least doesn't come across as deceptive (or poorly written), which was the case with how it was originally presented in Option #6. Option #8: Of the 50 sophomore students surveyed, 60% of boys and 90% of girls admitted to having had at least one alcoholic drink in the past three months. This is a very interesting approach. Revealing the exact number of surveyed students (without specific gender numbers) shows the reader that you're not pulling any punches. It also prevents the reader from assuming that the percentages do not reflect the entire sophomore class. It's semi-specific, accurate, and acceptable. More importantly, it hides the lack of female survey participants... until the reader checks the Appendix. Option #9: When asked whether they've consumed at least one alcoholic drink in the last three months, 90% of sophomores girls and 60% of sophomore boys admitted that they had done so. Easy tiger. Like with Option #4, this option leaves the data open to interpretation. It paints a picture that 90% of all sophomore girls and 60% of all sophomore boys drink! If your object was to show how much of a lush the average female teenager is... mission accomplished. Not only did you mask the numbers, but you manipulated the data by presenting only the percentages. You went all WCS Superintendent on these survey results! Without a doubt, 90% is bigger than 60%... but the 24 boys that drink far exceeds the nine girls that do. Again, while this is factually correct, it is a backhanded (and semi-desperate) way of presenting actual data. If you simply add the word "surveyed" after the word "boys" so that it reads "90% of sophomores girls and 60% of sophomore boys surveyed...", you reduce speculation (or misinterpretation) and keep it to just those surveyed. If the reader wants specific numbers on how many were surveyed, they can reference your Appendix. Option #10: Of the 50 sophomore students surveyed (10 female; 40 male), 33 admitted to having had at least one alcoholic drink in the past three months (9 female; 24 male). This is a very complete approach to presenting the same exact results that Options #1 through #9 did. Percentages are withheld since they would bog down an already very busy sentence. However, the use of semicolons and parentheses to house gender-specific data provides the most "bang" for the reader's "buck" (that is, if they paid to read this thing). As one can see, numbers can be dangerous. While this is not condoning "data manipulation", it does show why readers must approach the results of any survey with some mild hesitancy... and always ask: "Who says so and why?" As for interviews, under NO circumstances are you permitted to alter or amend a quote - or take it out of context - in order to "fit" your paper's "agenda". This is why a full transcript of the interview must be included in the Appendix. (NOTE: When you are done tallying your surveys... do NOT throw them away! All surveys will need to be kept for four years. You are not responsible for retaining this material. Rather, bring it in to class, and Dr. Hartnell will put it in a filing cabinet. After four years, all surveys will be shredded. This is done in the event any future researcher wishes to look at your raw numbers or if concerns arise over the validity of what you reported.) 
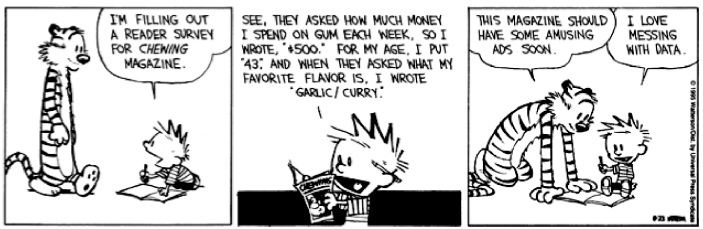
Says the guy using dice with two "6" sides... [Click picture for a larger version.]
|

If you crunch numbers long enough, you enter the word of "Tron"... [Click picture for a larger version.]
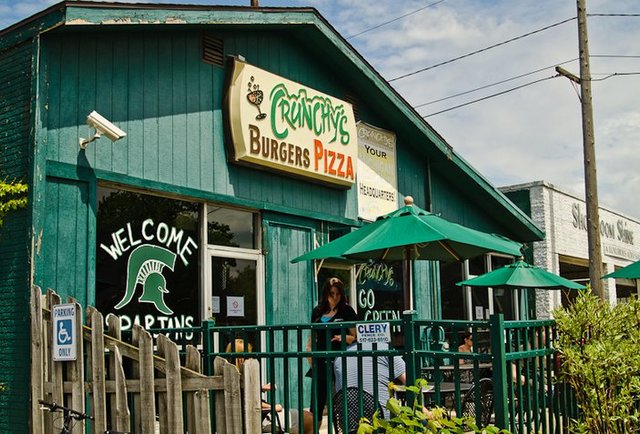
In college, Dr. Hartnell used to "crunch numbers" here... [Click picture for a larger version.]
See, I knew it! [Click picture for a larger version.]

The mid-90s were some lean years for ol' Mario and his "adventures"... [Click picture for a larger version.]
But you are still the father... [Click picture for a larger version.]
This cartoon will make more sense the longer you work on your C.A.R. [Click picture for a larger version.]

If that's what Her Majesty wants...

If you recognize the guy in the picture, this Meme is quite genius... [Click picture for a larger version.]

He's on to you... [Click picture for a larger version.]
Point taken... no need to shout. [Click picture for a larger version.]
Oh, really? Lemme get the vacuum... [Click picture for a larger version.]
No, you copied Robin's homework... [Click picture for a larger version.]

Deal with it, Woody... [Click picture for a larger version.]
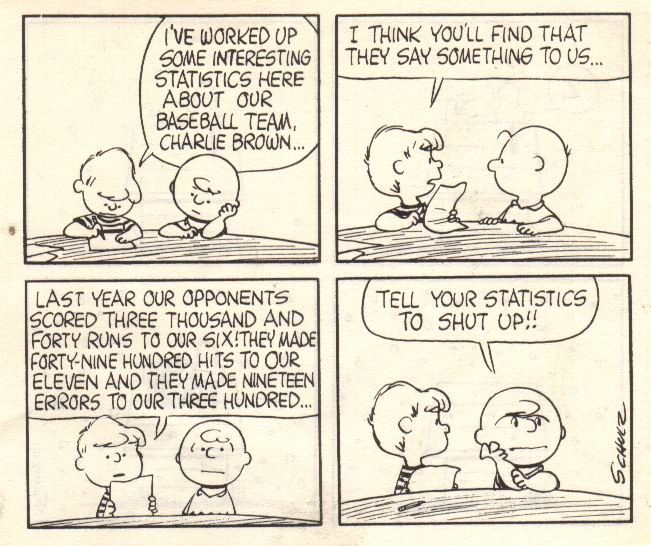
Poor Charlie Brown... [Click picture for a larger version.]
You're sassy, Mr. Clemens. Sassy. [Click picture for a larger version.]
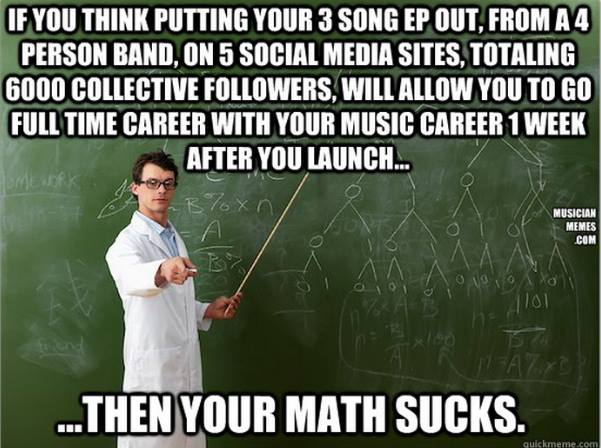
Just like your band... [Click picture for a larger version.]
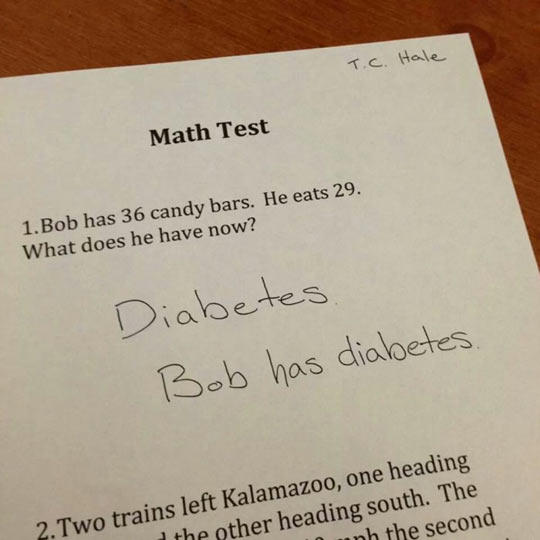
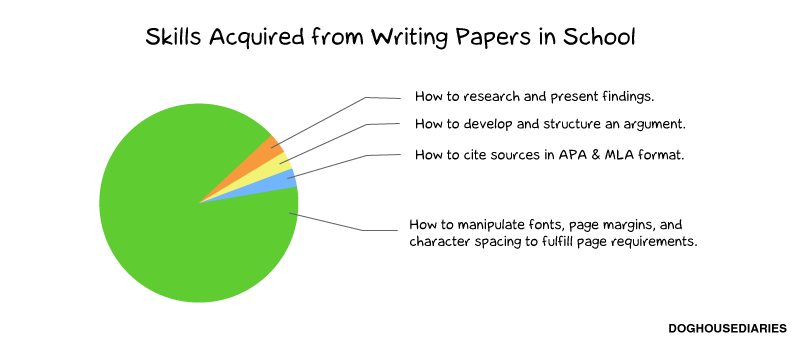
See! Math CAN be fun! [Click picture for a larger version.]

Big. [Click picture for a larger version.]
I'm not going to show my work, either... [Click picture for a larger version.]
Says the guy who wrote using a pen name... [Click picture for a larger version.]
|
Sidenote... doesn't the janitor in this cartoon look an awful lot like Calvin from "Calvin and Hobbes"? [Click picture for a larger version.]
STEP #6: Write the Research Process
|
Understandably, the entire C.A.R. project revolves around your research question. It sets up your inquiry and drives your study. All attempts to address or fix the problem are recorded and discussed in a section called "Research Process". Within this Research Process, you include the setting for your research, the participants involved, when everything took place, information about (but not the results of) any surveys used, information about (but not the results of) any tests used, information about (but not the results of) any observations or experiments conducted, and information about any other means of gathering data. (NOTE: The results of the Research Process are NOT revealed until the next section, which is the Data Analysis)
For helpful hints and to see a sample Research Process, click here. |

There is great joy when someone uses quote marks correctly... [Click picture for a larger version.]
Don't try it... [Click picture for a larger version.]
|
If you can find a parallel between increased grades and "bats"... then go for it... [Click picture for a larger version.]
STEP #7: Write the Data Analysis
|
This section, called the "Data Analysis", reveals the findings from the Research Process and often contains charts and graphs, survey results, polls, and other staples of reporting data. These findings come from all that number crunching and "fun with numbers".
The most critical part of the Data Analysis is your analysis and interpretation of the data. What worked? What didn't work? Was the problem remedied? Did nothing change? If your solution to a problem fails, that's OK! Some of the most important research builds off earlier attempts that fizzled out, were inconclusive, or went belly up. Remember... good C.A.R. projects are cyclical and set into motion the need for future research. Your grade will NOT be harmed if your C.A.R. doesn't "solve" the world's problems! For helpful hints and to see a sample Data Analysis, click here. |
I'm sorry... you were saying something? [Click picture for a larger version.]

Where were these questions when I was in school?! [Click picture for a larger version.]
|
Oh, I've had THIS conversation with a student before... [Click picture for a larger version.]
STEP #8: Write the Reflection
|
The most important piece of a C.A.R. project comes at the very end in a section called the "Reflection". (Remember... you are writing your C.A.R. out of order and according to this Step-by-Step Guide. But don't fret, unlike Humpty Dumpty, we CAN put this paper back together again.) In the Reflection, you take stock of your overall learning process during the research. The Reflection is a set of connections between the past, present, and future. The Reflection provides a deep understanding of why events occurred as they did and how those outcomes helped you address your main research question.
Looking back after collecting (and crunching) data, what thoughts come to mind? If you were to repeat the process, what would you change? What worked best for you? What failed? What most surprised you? At the conclusion of a good Reflection, you should know more than you did when you began. If you have not gained new insights about the problem and your problem-solving action, it is likely that this part turned into a summary, which it is not supposed to be! (NOTE: The section called the "Abstract" is used to summarize everything, NOT your Reflection.) For helpful hints and to see a sample Reflection, click here. 
That's deep... buuuut the wrong kind of reflection. [Click picture for a larger version.]
|
OK, now I get what that phrase means... [Click picture for a larger version.]
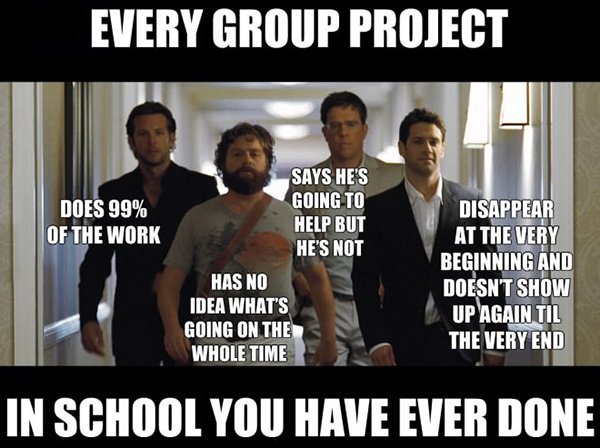
If you're reading this and wondering, "Wait, this can be a GROUP project?" then you didn't pay attention to Dr. Hartnell when the C.A.R. was assigned... [Click picture for a larger version.]
If you can do this, your mind is clear... and ready for reflection... [Click picture for a larger version.]
|
Bad. [Click picture for a larger version.]
STEP #9: Write the Action Plan
|
Where does your C.A.R. project go from here? What does the future hold for your research? At this point in the process, you have completed one full "cycle": planning à acting à observing à reflecting. But C.A.R. projects don't end there.
This section, called the "Action Plan", is where you send up the Bat-Signal and call on future researchers to swoop in and take over. Your Action Plan poses questions for future research. What should future researchers attempt to address? What direction would you like to see your C.A.R. go? If the problem wasn't "solved" during this cycle, what advice do you have for those that come after you? If the problem was "solved", what future problems might arise from having solved the original issue? Or, how might your solution be applied to another set of problems? The Action Plan of the written report is exciting because it is, in short, a "Last Will & Testament" – you are bestowing upon a new generation of researchers all of your hard work and handing them the torch. For helpful hints and to see a sample Action Plan, click here. |
Hey, that approach got me safely through the '80s... [Click picture for a larger version.]
Gravity 1, Cat 0. [Click picture for a larger version.]
|
Been there... [Click picture for a larger version.]
STEP #10: Write the Introduction
|
It may seem odd that you don't write your "Introduction" until Step #10, but, remember, it'll all come together in the end.
Your Introduction provides the significance of the problem you are addressing and where the problem is occurring (e.g. "How can the development of broader school spirit increase attendance at all Warrior sporting events and extra-curricular activities?"). The reader needs to be invited to think about the problem at the widest level. Your Introduction should answer the question: "Why should I read this?" and "Why should I care?" You do not go into the details of what you did or what results you found. The Introduction is solely about the problem and how it is linked to your vision for a different future. For helpful hints and to see a sample Introduction, click here. |

Just remove the colon and nobody gets hurt... [Click picture for a larger version.]
|
I'm actually using one of Calvin's "blocks" right now... [Click picture for a larger version.]
STEP #11: Write the Abstract
|
Think of your "Abstract" as the summary of your entire C.A.R. project. If you Google-searched your topic, your Abstract would be the Web result. As such, this is a beefed-up, run-on paragraph (that's over 10 sentences in length) that sheds light on the topic you chose, the research you completed, the literature you reviewed, the results you gathered, and the direction that future research should go from there. The Abstract is so important to a C.A.R. project that it is placed on its own page.
For helpful hints and to see a sample Abstract, click here. |

What's disturbing is that this is SOOOOO true. [Click picture for a larger version.]
|
Exactly how old is this cartoon? [Click picture for a larger version.]
STEP #12: Finalize the Annotated Bib and Appendix
|
It goes without saying that as you gather sources for your Literature Review... you write them down or record them in some fashion!!! Trying to track down a source after the fact is frustrating, especially when all you remember about it is "it was about school". That doesn't exactly narrow it down, does it? Besides, in order to properly cite your sources throughout your paper, you need page numbers and other MLA- required information. (For an MLA "refresher" and to revisit how to cite information, click here.)
Bibliographies, References, and Works Cited pages come at the end of most book reports and traditional research papers. Because C.A.R. projects are cyclical and their goal is to inspire future research into a problem, they utilize "Annotated Bibliography" pages. While organized in the same fashion as a Reference or Works Cited page (MLA format), an Annotated Bibliography page differs because beneath each entry is a single-spaced paragraph that summarizes what information that source contained and why it was valuable to your research. Much of this information comes from your Literature Review. (NOTE: All sources that appear in your Annotated Bibliography MUST be referenced at some point in your paper.) By this time in the process, your Appendix is, essentially, complete. You will need to include an electronic copy of your survey(s) and/or interview(s). For surveys, a tally sheet will also need to be included. This means if your survey was made up of multiple-choice questions, you need a copy of the survey with how many selected A, B, C, etc. If you further broke your survey down by grade-level, gender, race, and so forth, additional sheets with those tallies will also need to be included. Questions that prompted extended response answers do not need to be submitted. For interviews, a copy of the questions asked and all responses must be included. (NOTE: When you are done tallying your surveys... do NOT throw them away! All surveys will need to be kept for four years. You are not responsible for retaining this material. Rather, bring it in to class, and Dr. Hartnell will put it in a filing cabinet. After four years, all surveys will be shredded.) For helpful hints and to see a sample Annotated Bibliography, click here. For helpful hints and to see a sample Appendix, click here. |

Not with an attitude like that, mister! [Click picture for a larger version.]

And just wait until Heidi sees it... oh well. Make it work. [Click picture for a larger version.]

The cat's not kidding, either. Cite it! [Click picture for a larger version.]

Eventually you kinda need to do it... [Click picture for a larger version.]
|
See you down there! [Click picture for a larger version.]
STEP #13: Create the Cover Page
|
You're now going to do the part of the project that you normally always start with... the "Cover Page".
This is exactly what it says it is, so don't think too hard on this one. There are some specific items that need to appear on your Cover Page, so don't type your name and slap on some clipart and think you're done. For helpful hints and to see a sample Cover Page, click here. |

Avoid this... [Click picture for a larger version.]
|
Sometimes I judge books by their covers, so why not your C.A.R.? [Click picture for a larger version.]
STEP #14: Present your findings
|
The second piece to getting your C.A.R. results "out
there" comes in the presentation. Sharing your process of inquiry allows you to
continually reflect on what you did and lets your peers contribute feedback and
support. Whether this is a Power Point in class, the creation of a website, or
a presentation to the School Board or Front Office is solely left up to you.
(All presentation ideas must be approved by Dr. Hartnell.) This piece of the C.A.R. project will take careful planning in order to
guarantee your results are accurately and fairly presented.

Is it set up like your bank account? [Click picture for a larger version.]
|
Hands down this was the best quote from "Billy Madison"... and one I hope to use in class one day... [Click picture for a larger version.]

If you do this, then I will be able to bust out the "Billy Madison" line... [Click picture for a larger version.]
|
Batman bugs me at times... [Click picture for a larger version.]
STEP #15: TURN IT IN!
|
With your C.A.R. final paper complete... and with your findings presented... you, my friend, are D-O-N-E. (Don't forget to turn in all of your surveys and interviews!)
You may now go make fun of those that haven't started... 
To celebrate, go tip a trash can... [Click picture for a larger version.]
|

Best. Feeling. EVER.
|

Go ahead... you've earned it... [Click picture for a larger version.]
Is there a sample C.A.R. project I can look at?

Unless tomorrow is a Monday... [Click picture for a larger version.]
|
I'm guessing the latter of the two... [Click picture for a larger version.]
Oh no! You figured it out! [Click picture for a larger version.]
|
GET STARTED NOW!!!
Hey... it works for some people... [Click picture for a larger version.]